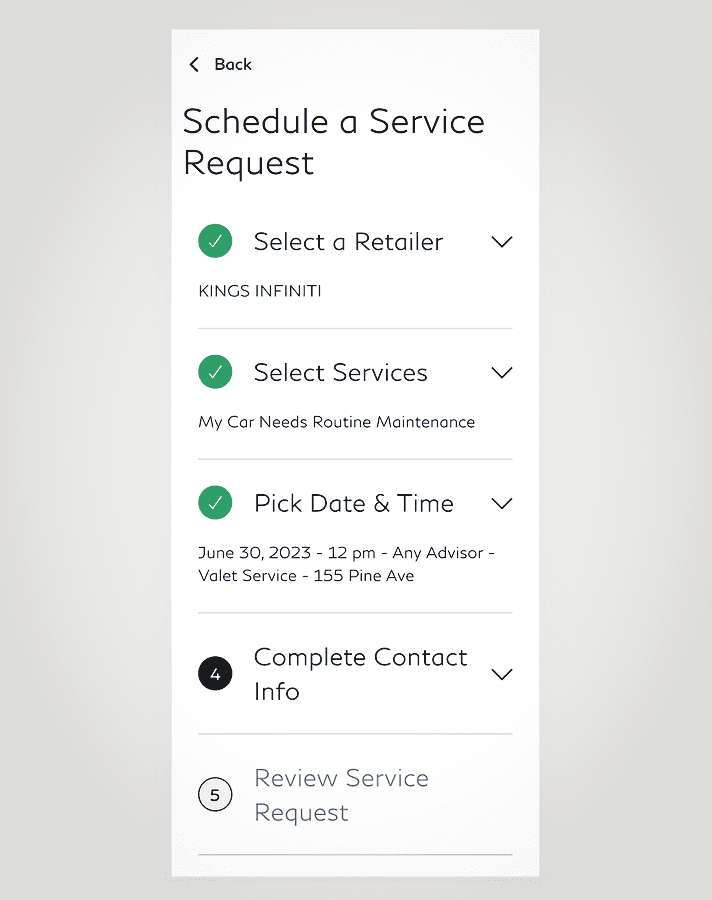
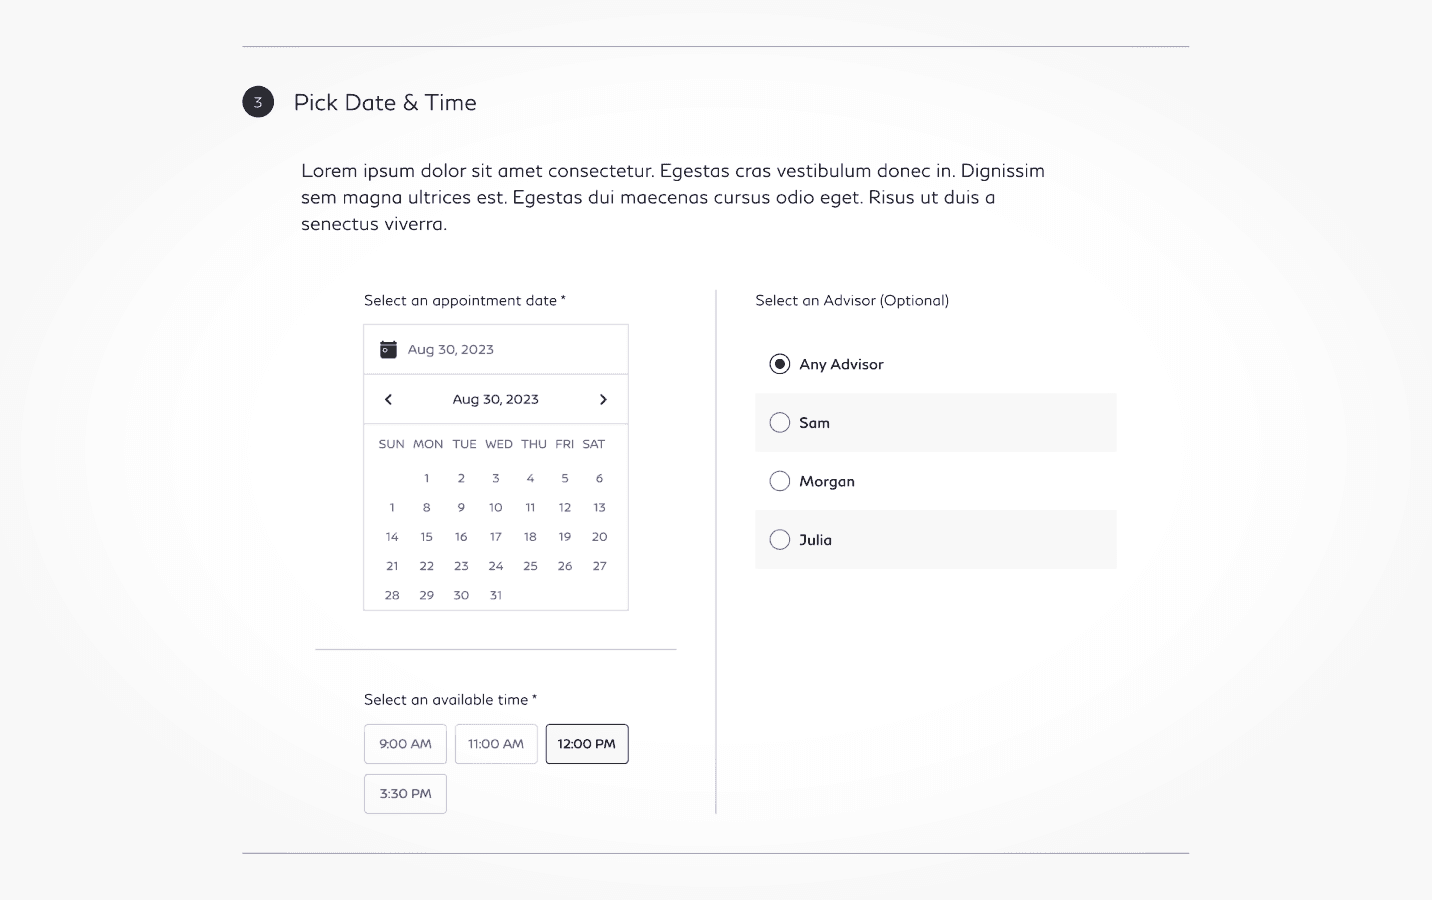
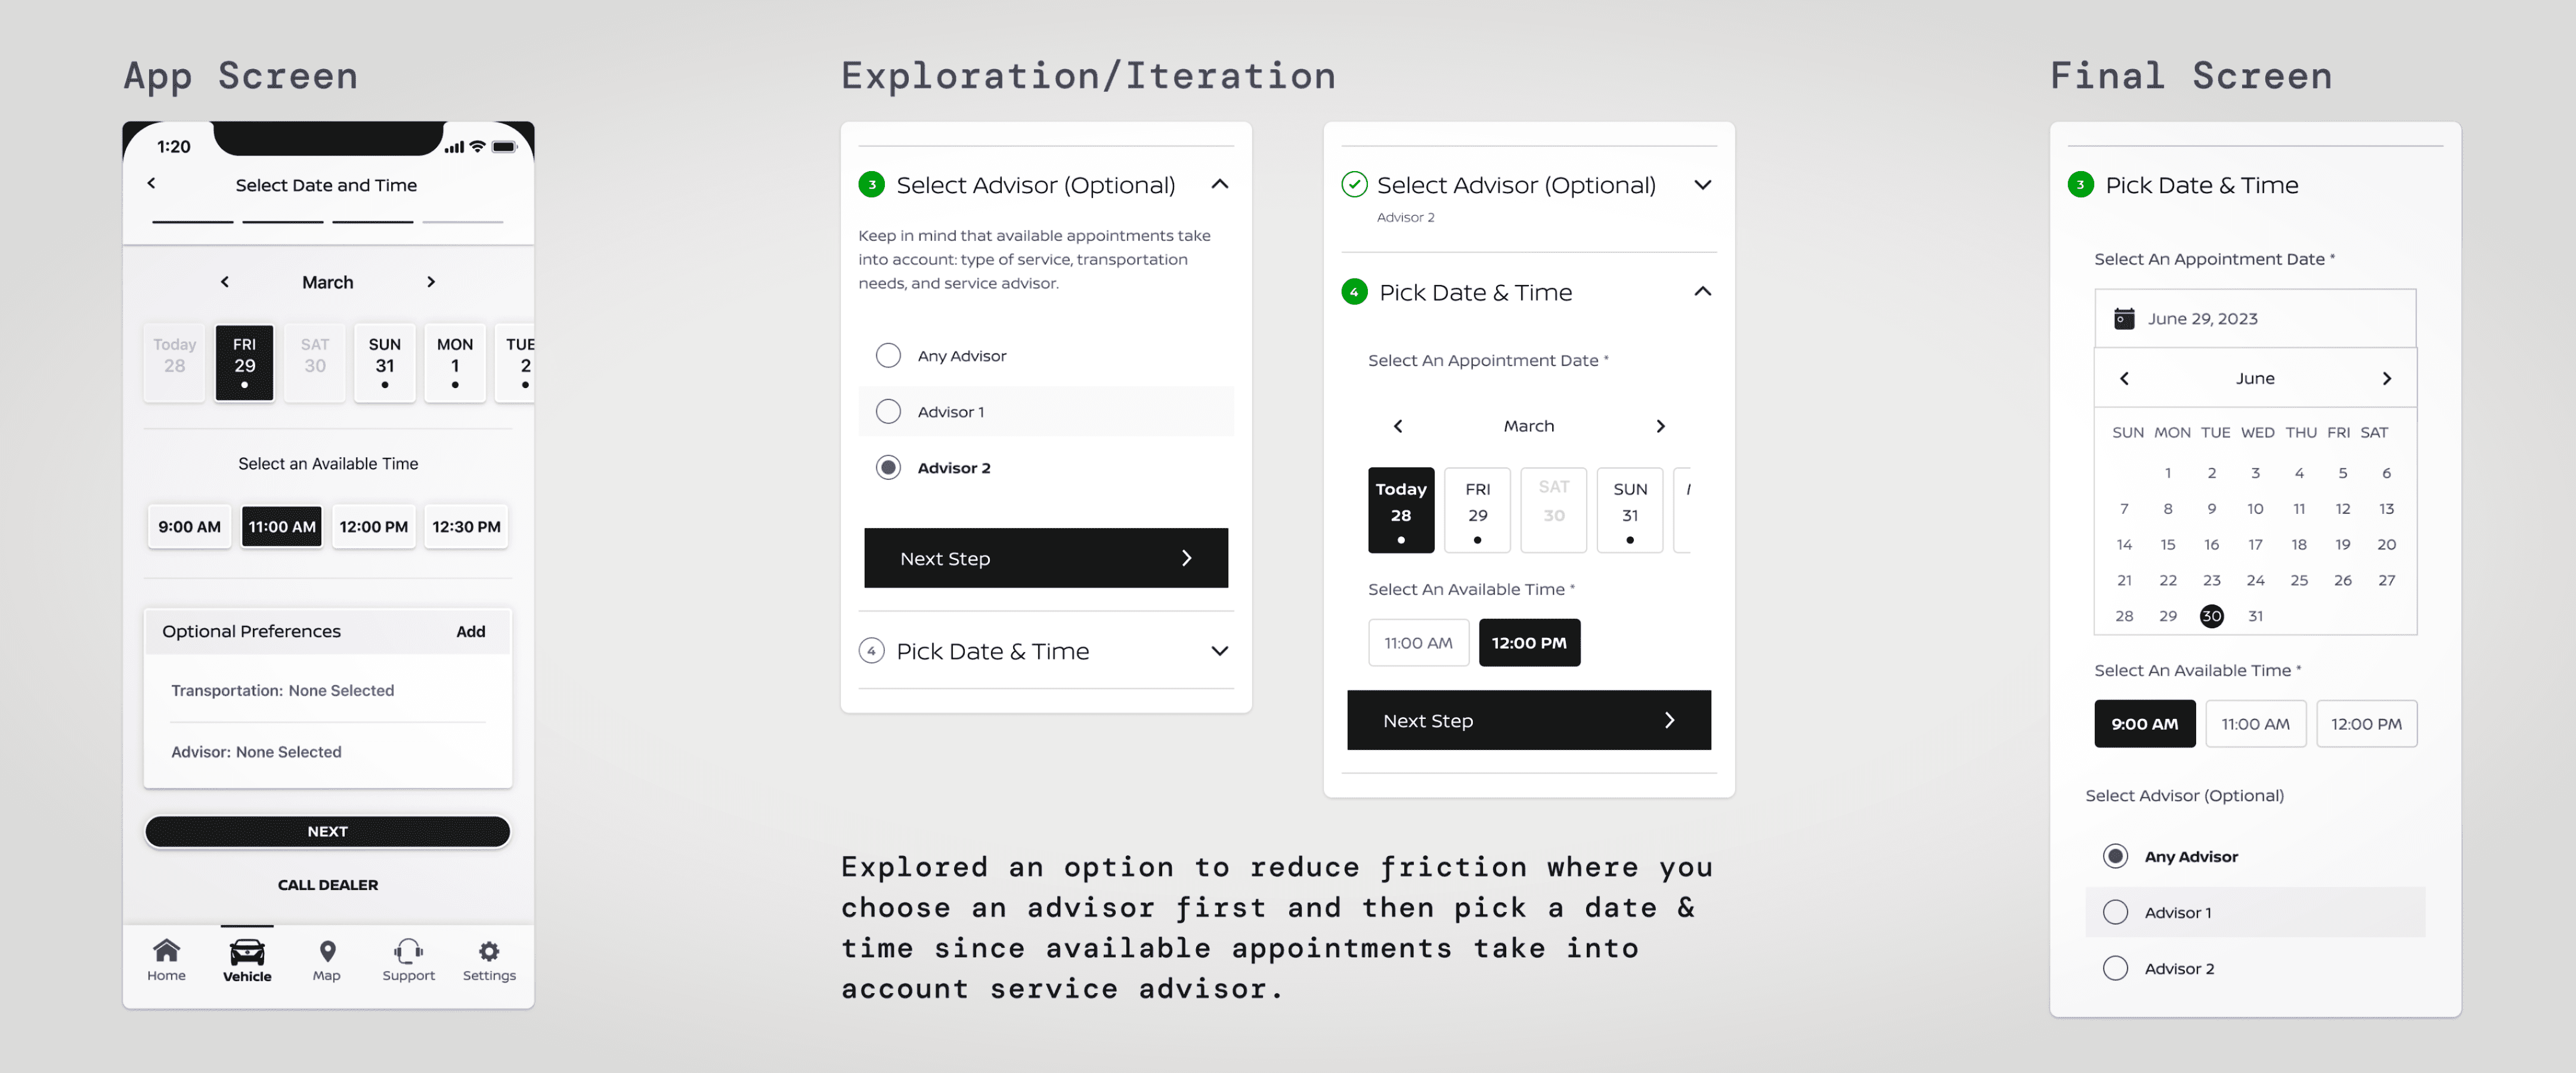
📱 Product: a native, cross-platform service scheduling integration that replaced fragmented third-party redirects with a unified 5-step scheduling engine.
👩💻 My role: I spearheaded end-to-end UX for over 12 months along with 2 developers, 1 visual designer, and 1 content designer, as well as with other US external teams. I designed a linear flow that transformed a technical black box into a guided journey.
📊 Outcomes:
• Higher engagement: the "Schedule a Service" feature achieved a 13% click-through rate.
• Performance: within the first 90 days of launch, it became the #1 most visited page in the entire client portal.
• Unified brand: successfully bridged the gap into one cohesive Nissan experience.
✂️ What we cut: a non-linear flow when completing the 5-step process. Due to service availability being tied to specific dealers and vehicle models, we pivoted to a linear flow, preventing any dead ends in the process.
🧠 Lessons Learned: the backend logic became the primary architect of the user journey. I had to pivot from a "choose your own adventure" to a structured, linear flow to make sure users didn’t select a service from a dealer that couldn't actually provide.
📱 Product: the Additional Driver feature allows Nissan owners to grant, revoke, and customize vehicle access for friends and family across web and mobile.
👩💻 My role: I was the sole designer overseen by a UX Director. I led the end-to-end design for 8 months, owning user flows, initial concepts, and high-fidelity prototypes. I worked closely with 2 developers, 1 visual designer, 1 content designer, and synced with external US teams for cross-regional parity.
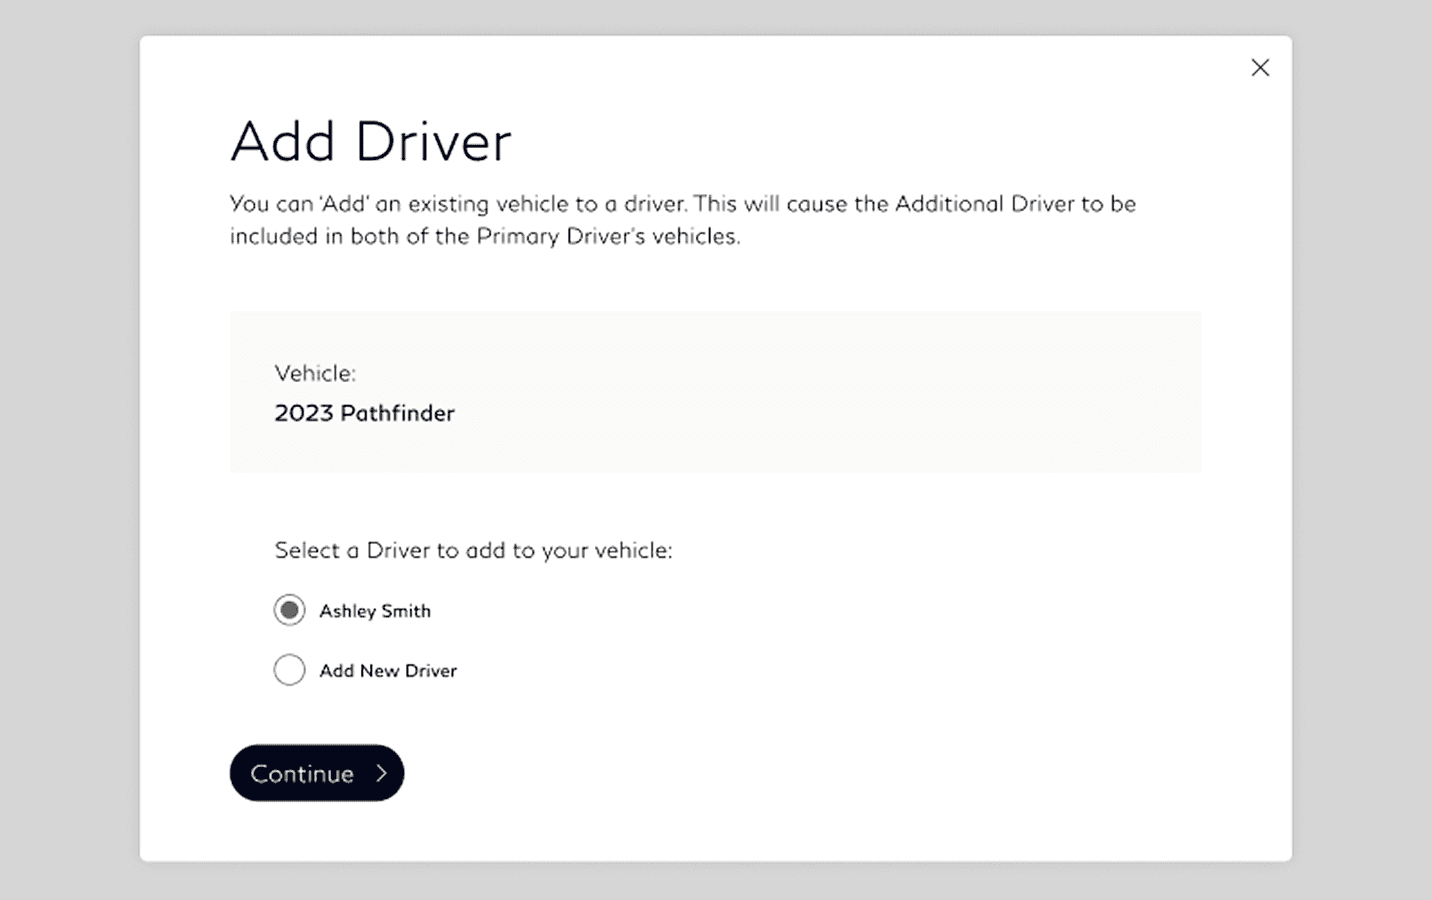
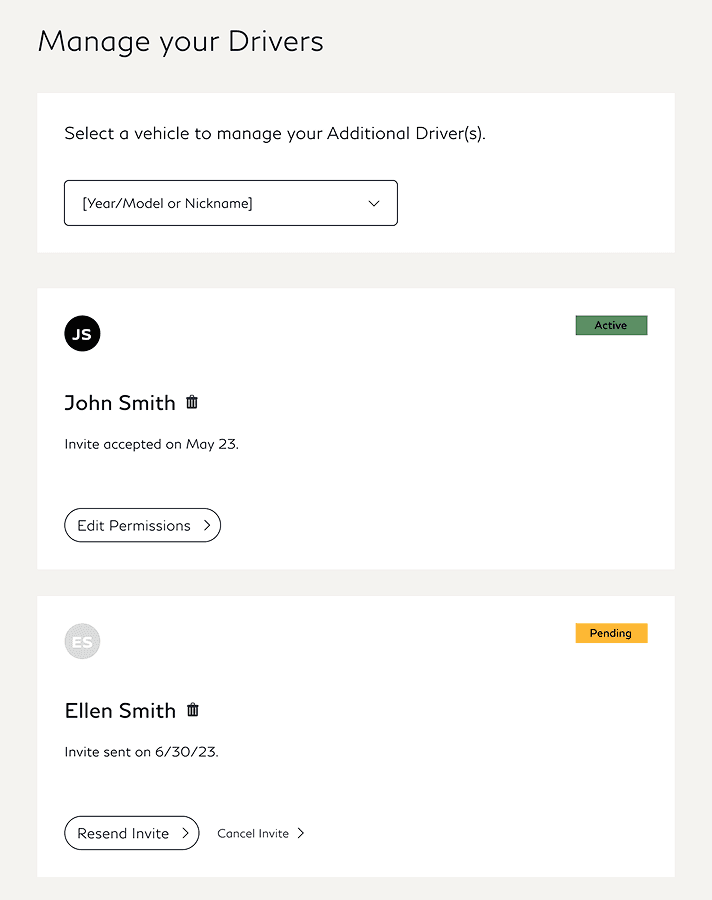
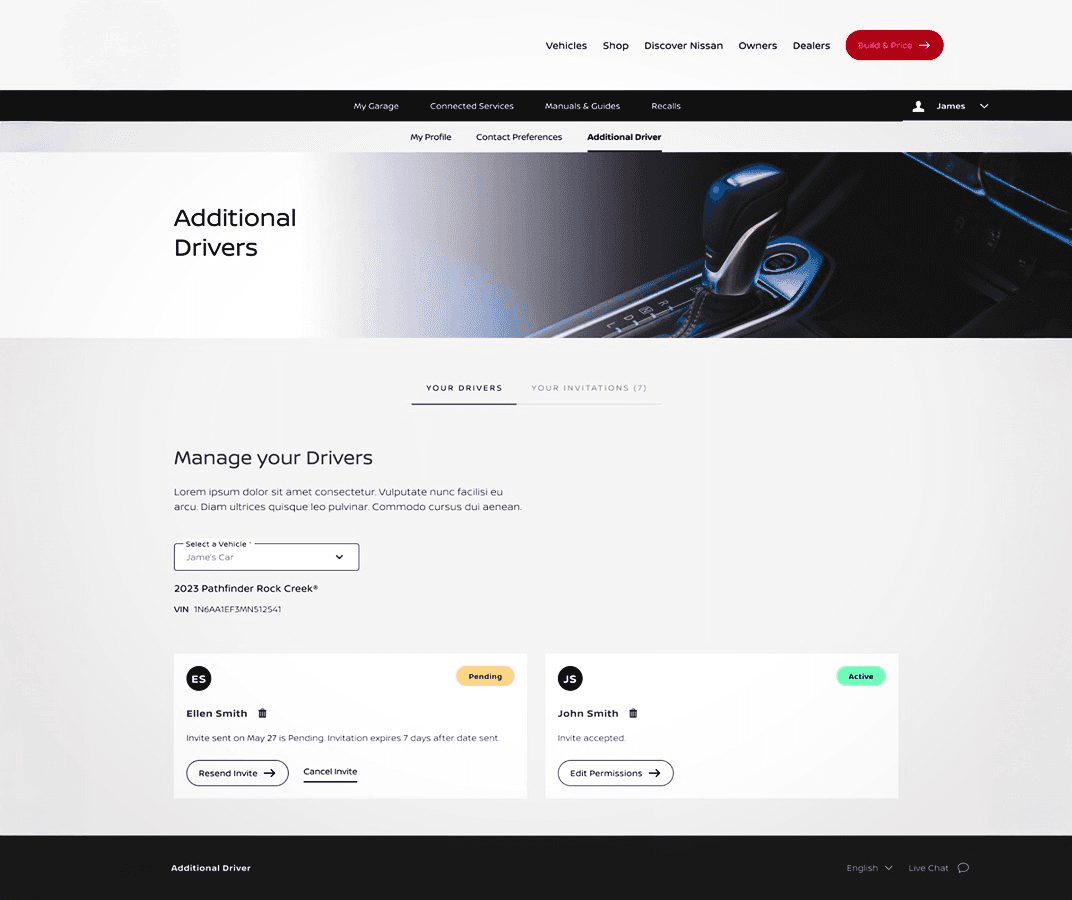
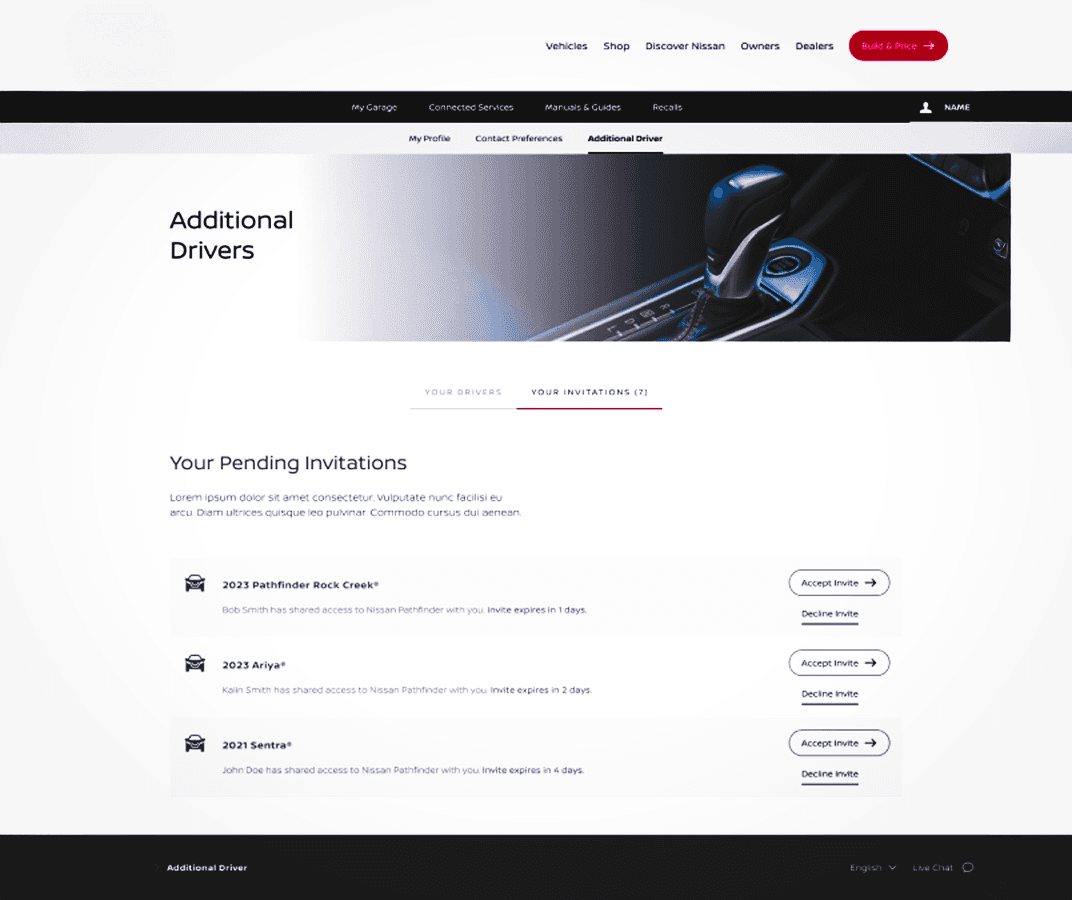
🎯 Who it’s for: owners can choose different settings, set speed boundaries and customize permissions, allowing each driver a unique experience in their vehicle. This feature is available to all vehicle models and can be found in the Client Portal and the app.
There are two types of users:
• Primary driver: the person who owns the vehicle and can add Additional Drivers.
• Additional/Secondary driver: the person associated with the vehicle and invited/added by the Primary Driver.
💡 The bet: the challenge was distinguishing an owned vehicle versus being added to a vehicle as an additional driver. My initial thought was to have separate flows, treating it as a feature within your profile. We veered away from our initial thinking due to secondary drivers aka ‘additional drivers’ permissions. So we ended up treating it as a vehicle itself. By adding shared vehicles into the main vehicle dropdown, we created a mental model where access meant ownership.
⚠️ Top Constraints
• We didn’t have a native notification center within the Client Portal. I had to design a notification button to handle invitations. The compromise was that it was viewed within a vehicle dashboard that users didn't actually own.
• Both drivers were required to have profiles created in the vehicle's physical head unit. I had to bridge the digital portal and the physical car.
• Due to technical limitations, we couldn't verify email or phone inputs in real-time. A single typo could break the invitation loop.
📊 Outcomes: the additional driver feature is still pre-launch but we considered the following to measure success:
• Invitation Completion Rate: percentage of sent invites that were accepted.
• Discoverability: tracking CTRs on the notification button to see if users found the entry point without a traditional notification center.
• Switching drivers: tracking primary drivers switching to their shared vehicle.
✂️ What we cut
• We deprioritized individual feature toggles in favour of a group permission to reduce backend load.
• We cut the save contact ability due to legal and API limitations. Users had to re-invite a driver for each new vehicle
• We also cut the ability to move a driver from one vehicle to another for the same reasons as above.
🧠 Lessons Learned
• Bridging the digital portal and the physical car taught me how to balance visibility with contextual relevance.
• This project tested how the Client Portal scaled, and the relationship between profiles, permissions, and vehicle dashboards.
📱 Product: A user testing pilot program for the City of Calgary to improve access to their digital services by identifying common usability barriers for each subpopulation.
👩💻 My role: I was one of the five UX Researchers in the project, plus 1 design lead, 1 product manager, and 1 client stakeholder. As a facilitator and note-taker, I ran 4/8 unmoderated usability tests. I analyzed the findings and produced insights and recommendations that were later compiled in a report.
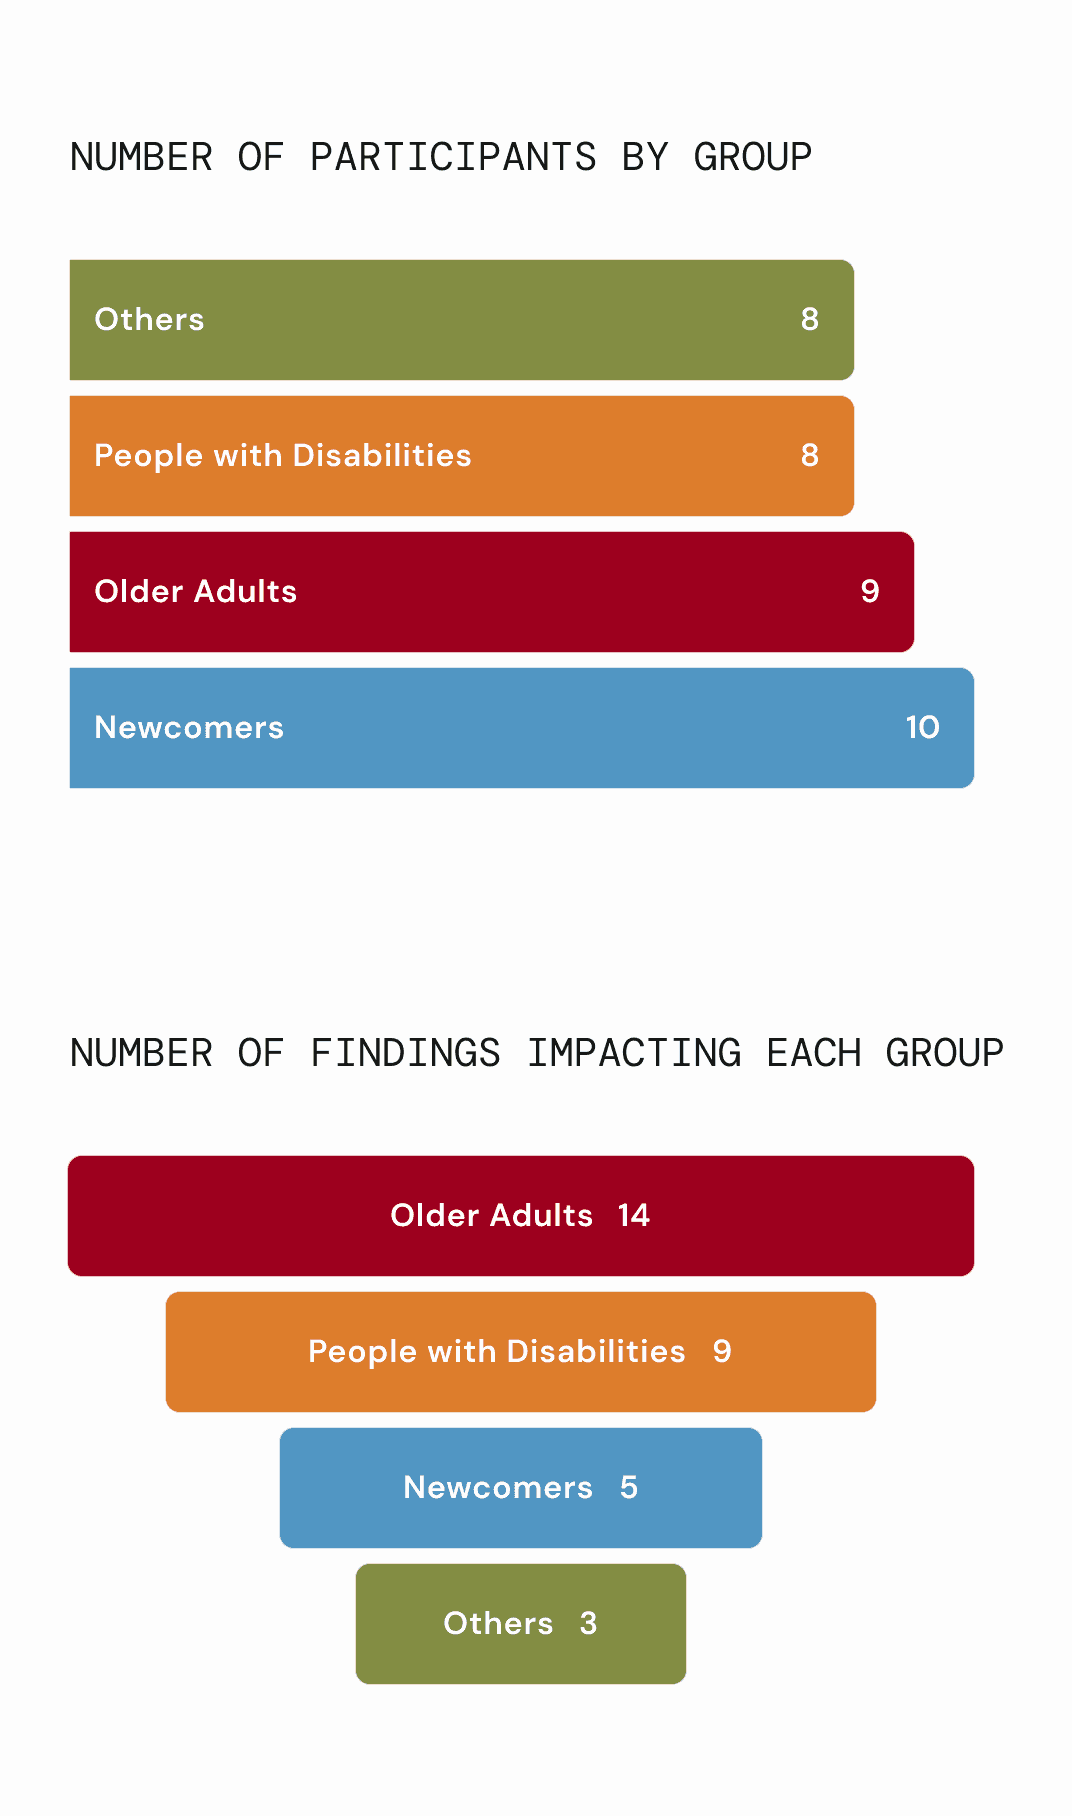
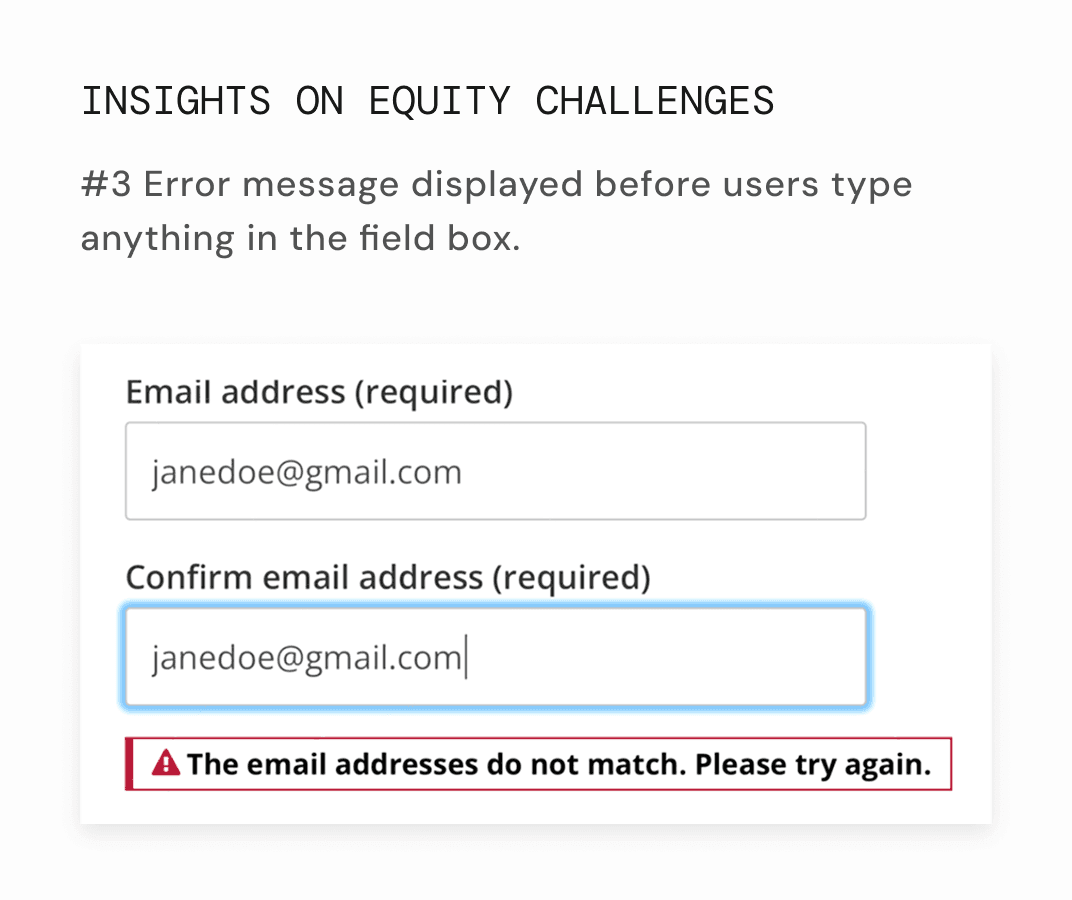
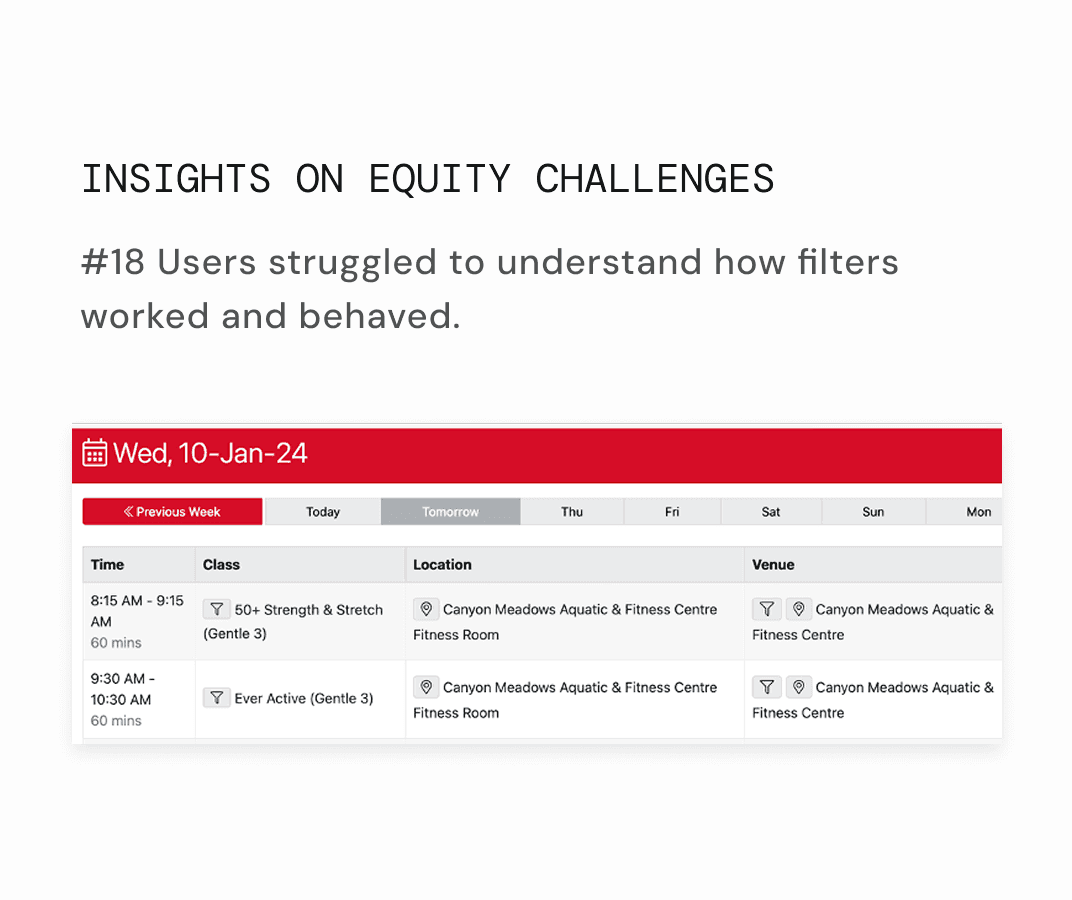
🎯 Who it’s for: the City of Calgary partnered with InluCity Calgary to run a usability testing program to improve digital equity across 1.3 million residents. The pilot program focused on five equity groups labelled as Newcomers to Canada, People with different disabilities, Older Adults, and Others (users who live in Calgary but don’t fit into the above groups). A total of 35 participants were interviewed on seven different services, and categorized into five groups.
💡 The Challenge
• Designing a service when everybody is a user. Everyone has access to the same outcomes from our digital information and services, regardless of their economic, technological, ethnic, disabilities or educational background.
• Operationalize user testing as a practice for digital service development beyond the pilot phase.
• Create organizational change by demonstrating the value of user testing when building services and programs.
⚠️ Top Constraints
• Finding users willing to attend the session. Some groups were harder to recruit than others.
• What impacts one particular group vs. what could be an issue to any user?
📊 Outcomes
• Identified 18 equity challenges affecting one or more groups and opportunities for improvement across these seven services.
• The pilot program got a lot of traction within the city of Calgary. More departments and services are interested in user testing with equity deserving groups, resulting in increasing digital equity.
📱 Product: a complete redesign of Nissan’s Client Portal, moving away from a limited secondary navigation system to a modular, data-driven dashboard that scales along the owner's vehicle lifecycle. The redesign expanded customer-specific services, prioritizing content usability and real-time vehicle data. As a result, exit rates improved by 64%.
📊 Outcomes
• Optimized Navigation: CTRs numbers validated a more intuitive flow, allowing owners to complete high-value tasks like scheduling service.
• Deeper Engagement: owners moved from the dashboard page to the detailed secondary pages.
• Increased retention: improved exit rates by 64%, as owners found the information they were looking for straight away.
✂️ What we cut
• Fleet Management: We deprioritized fleet-specific dashboards to focus on the high-volume consumer and family vehicle segment.
• Service History Records: previous services would not be shown, mostly due to API limitations and budget constraints. Instead, we focused on upcoming maintenance.
🧠 Lessons Learned
• The value of decoupled UI: designing the dashboard as the sum of independent modules made the portal future-proof.
• Future-Proofing for Launch Delays: in long 12-month projects, things move at different speeds. I learned to design bridge states, ensuring the user experience never felt half-finished.
📱 Product: an interactive game designed for grade-school children to go on virtual field trips using Cesium for Unreal and the Google Maps Platform's Photorealistic 3D Tiles.
👩💻 My role: creative designer and storyteller, collaborating with the founder, two developers, one geospatial engineer, a game designer, and a PM to design the menu and controls for the gamified learning interface.
🎯 Who it’s for: K-12 students and educators—ranging from elementary learners studying animal habitats to high schoolers simulating environmental impact on watersheds—as well as industrial teams using digital twins for remote site training.
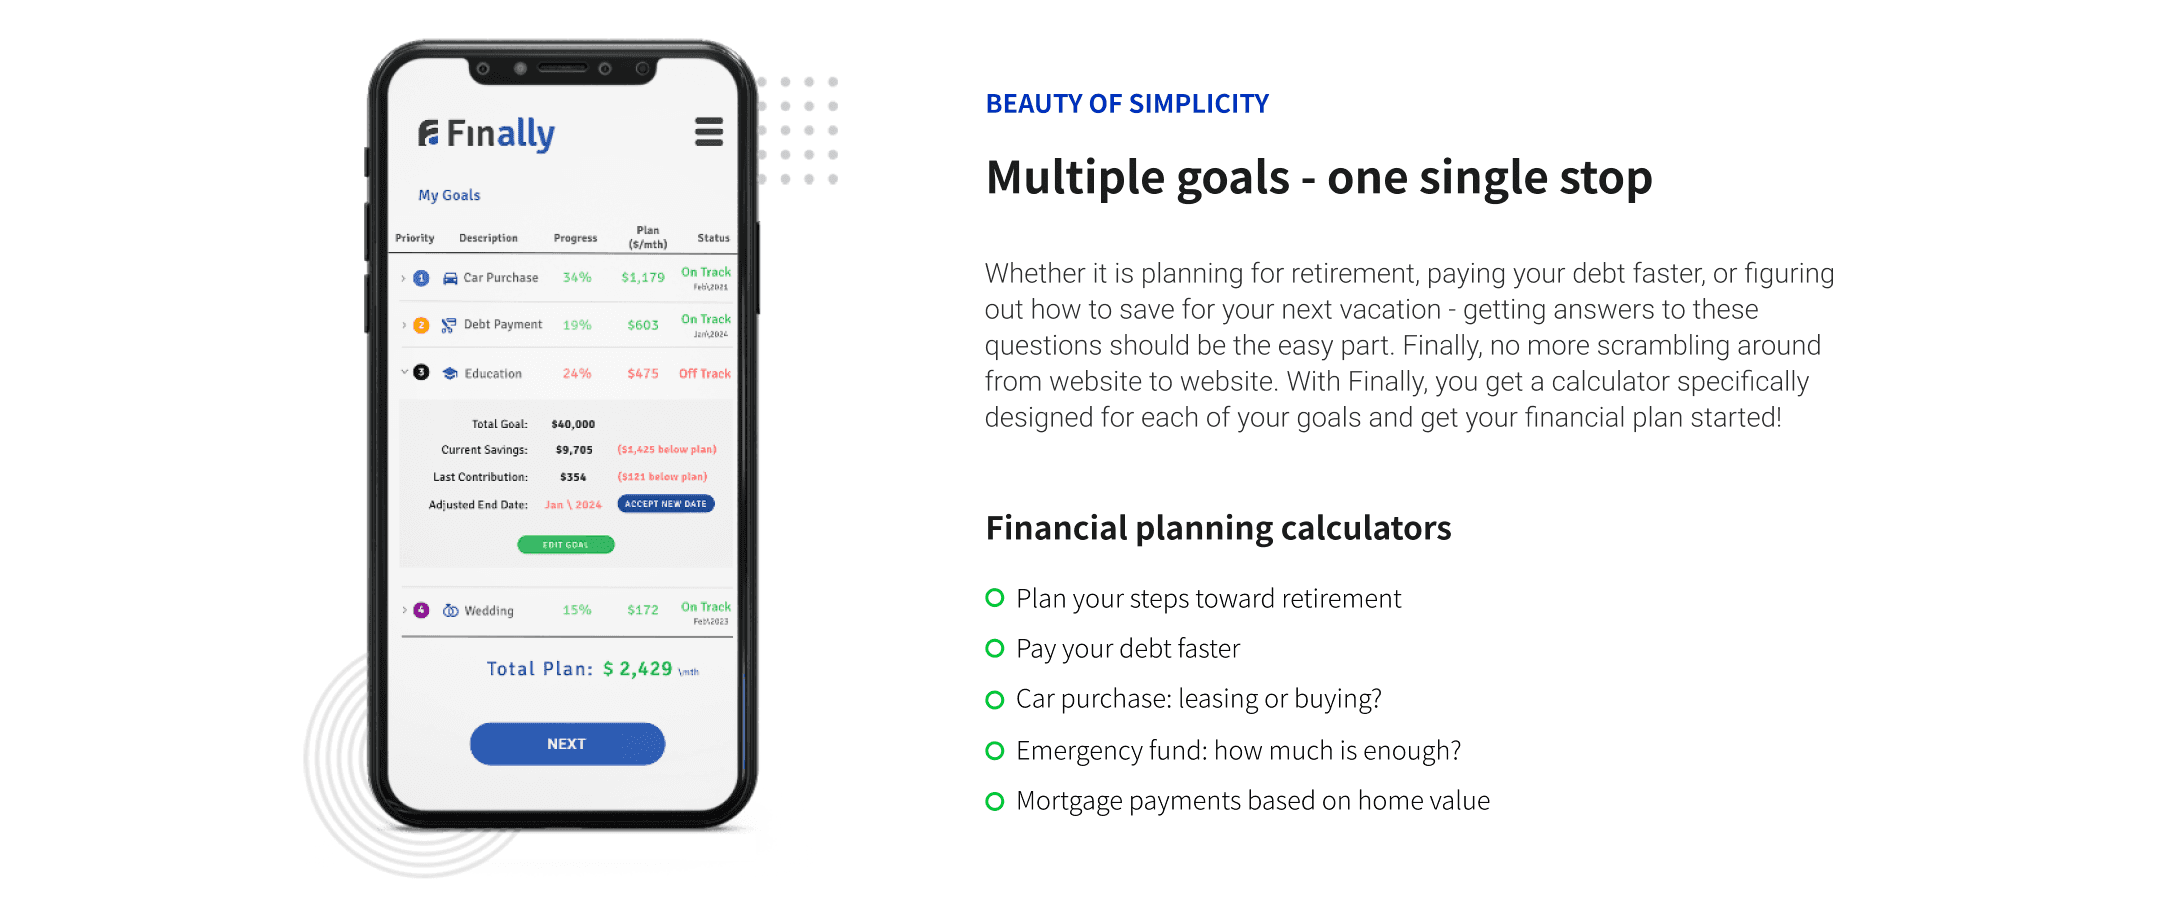
📱 Product: a redesign of Finally’s landing page to increase conversion rates to the free tier plan.
🔎 Research I ran six unmoderated usability testings using Lookback. Four out of six testers were in the same segment as Finally’s targeted audience.
• Preference to sign up with social media.
• Being more transparent and upfront with privacy, data storage, and account security.
• A security question as an alternative to a password was confusing and not familiar.
📊 Outcomes
• Added a FAQ section addressing user concerns on privacy and security discovered during testing.
• Streamlined signing-up flow with standard social SSO and password affordances.
• Optimized the landing page for scanning so users understood the value proposition faster.
✂️ What we cut
• Replacing a password with a security question to login was proven wrong. I thought I could reduce the cognitive load of users remembering a password. Familiarity wins over new methods.
• Removing the pricing model section from the home page to focus on the Free Plan and eliminate any perceived commitments for first-time visitors.
• Displaying all the different financial simulators on the home page to avoid analysis paralysis.
🧠 Lessons Learned
• The Fidelity Paradox: the closer that prototypes look like the real product are more effective when testing with users.
• Trying to innovate the login flow by replacing passwords with security questions failed. Familiarity is a feature, not a lack of creativity.
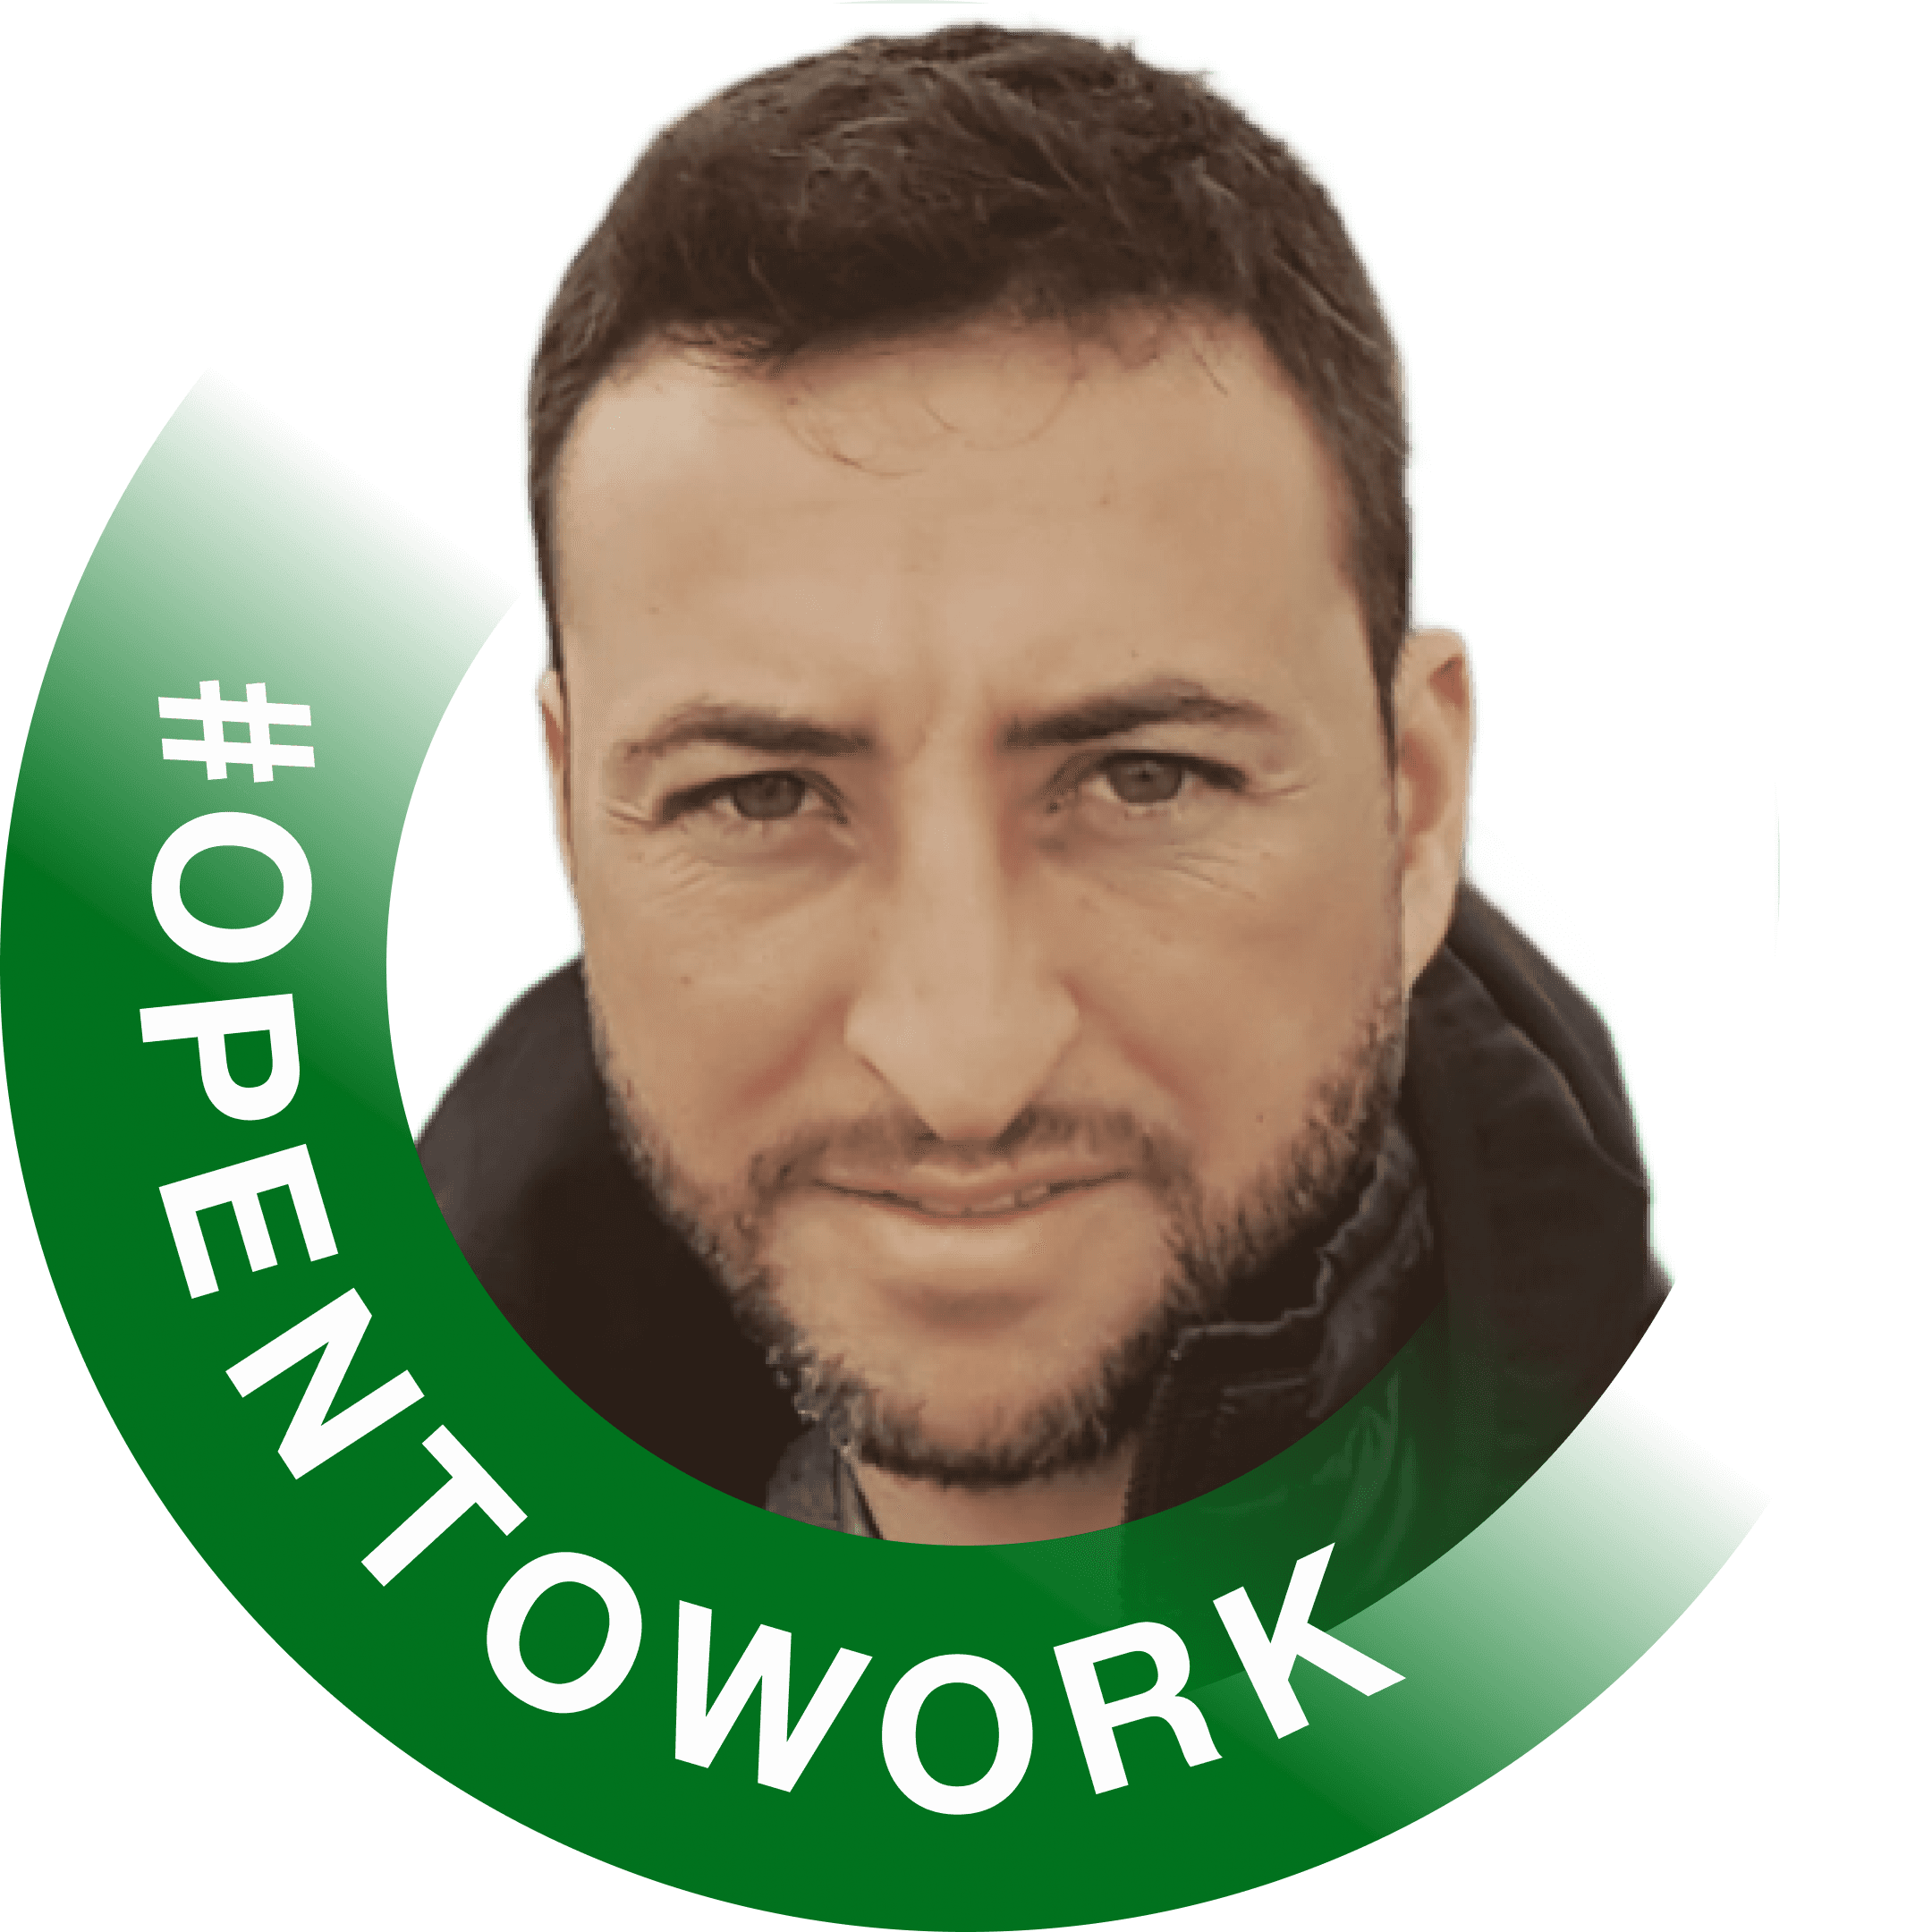
I'm an Irish-born designer who grew up in Argentina and moved to Canada in 2017. I initially pursued a corporate career until discovering design—the perfect mix of creativity, people, and technology. PTK has a bachelor's degree in business and enjoys solving problems with an outside-in design approach. Some would describe PTK as a unique blend with creative notes, who loves travelling and trying new foods.
Others would describe PTK as a systems thinker ready to team up with you. Let's bounce ideas, learn from each other, and build products together from start to finish.
What makes me different from other designers is that I strive to understand the problem and its backstory. This allows me to craft solutions that not only follow affordances but are feasible from both a development and requirement perspective.
PTK's design process starts by empathizing with users to deeply grasp their needs. I then collaborate with teams to craft simple and refined solutions, and continually refine them based on user feedback. I try really hard to innovate and push existing limits. This process is a continuous cycle, rinse & repeat, that I apply to all my work.


